|
|
||
|---|---|---|
| LICENSE | ||
| README.md | ||
| fritzbox.conf | ||
| grafana_dashboard.json | ||
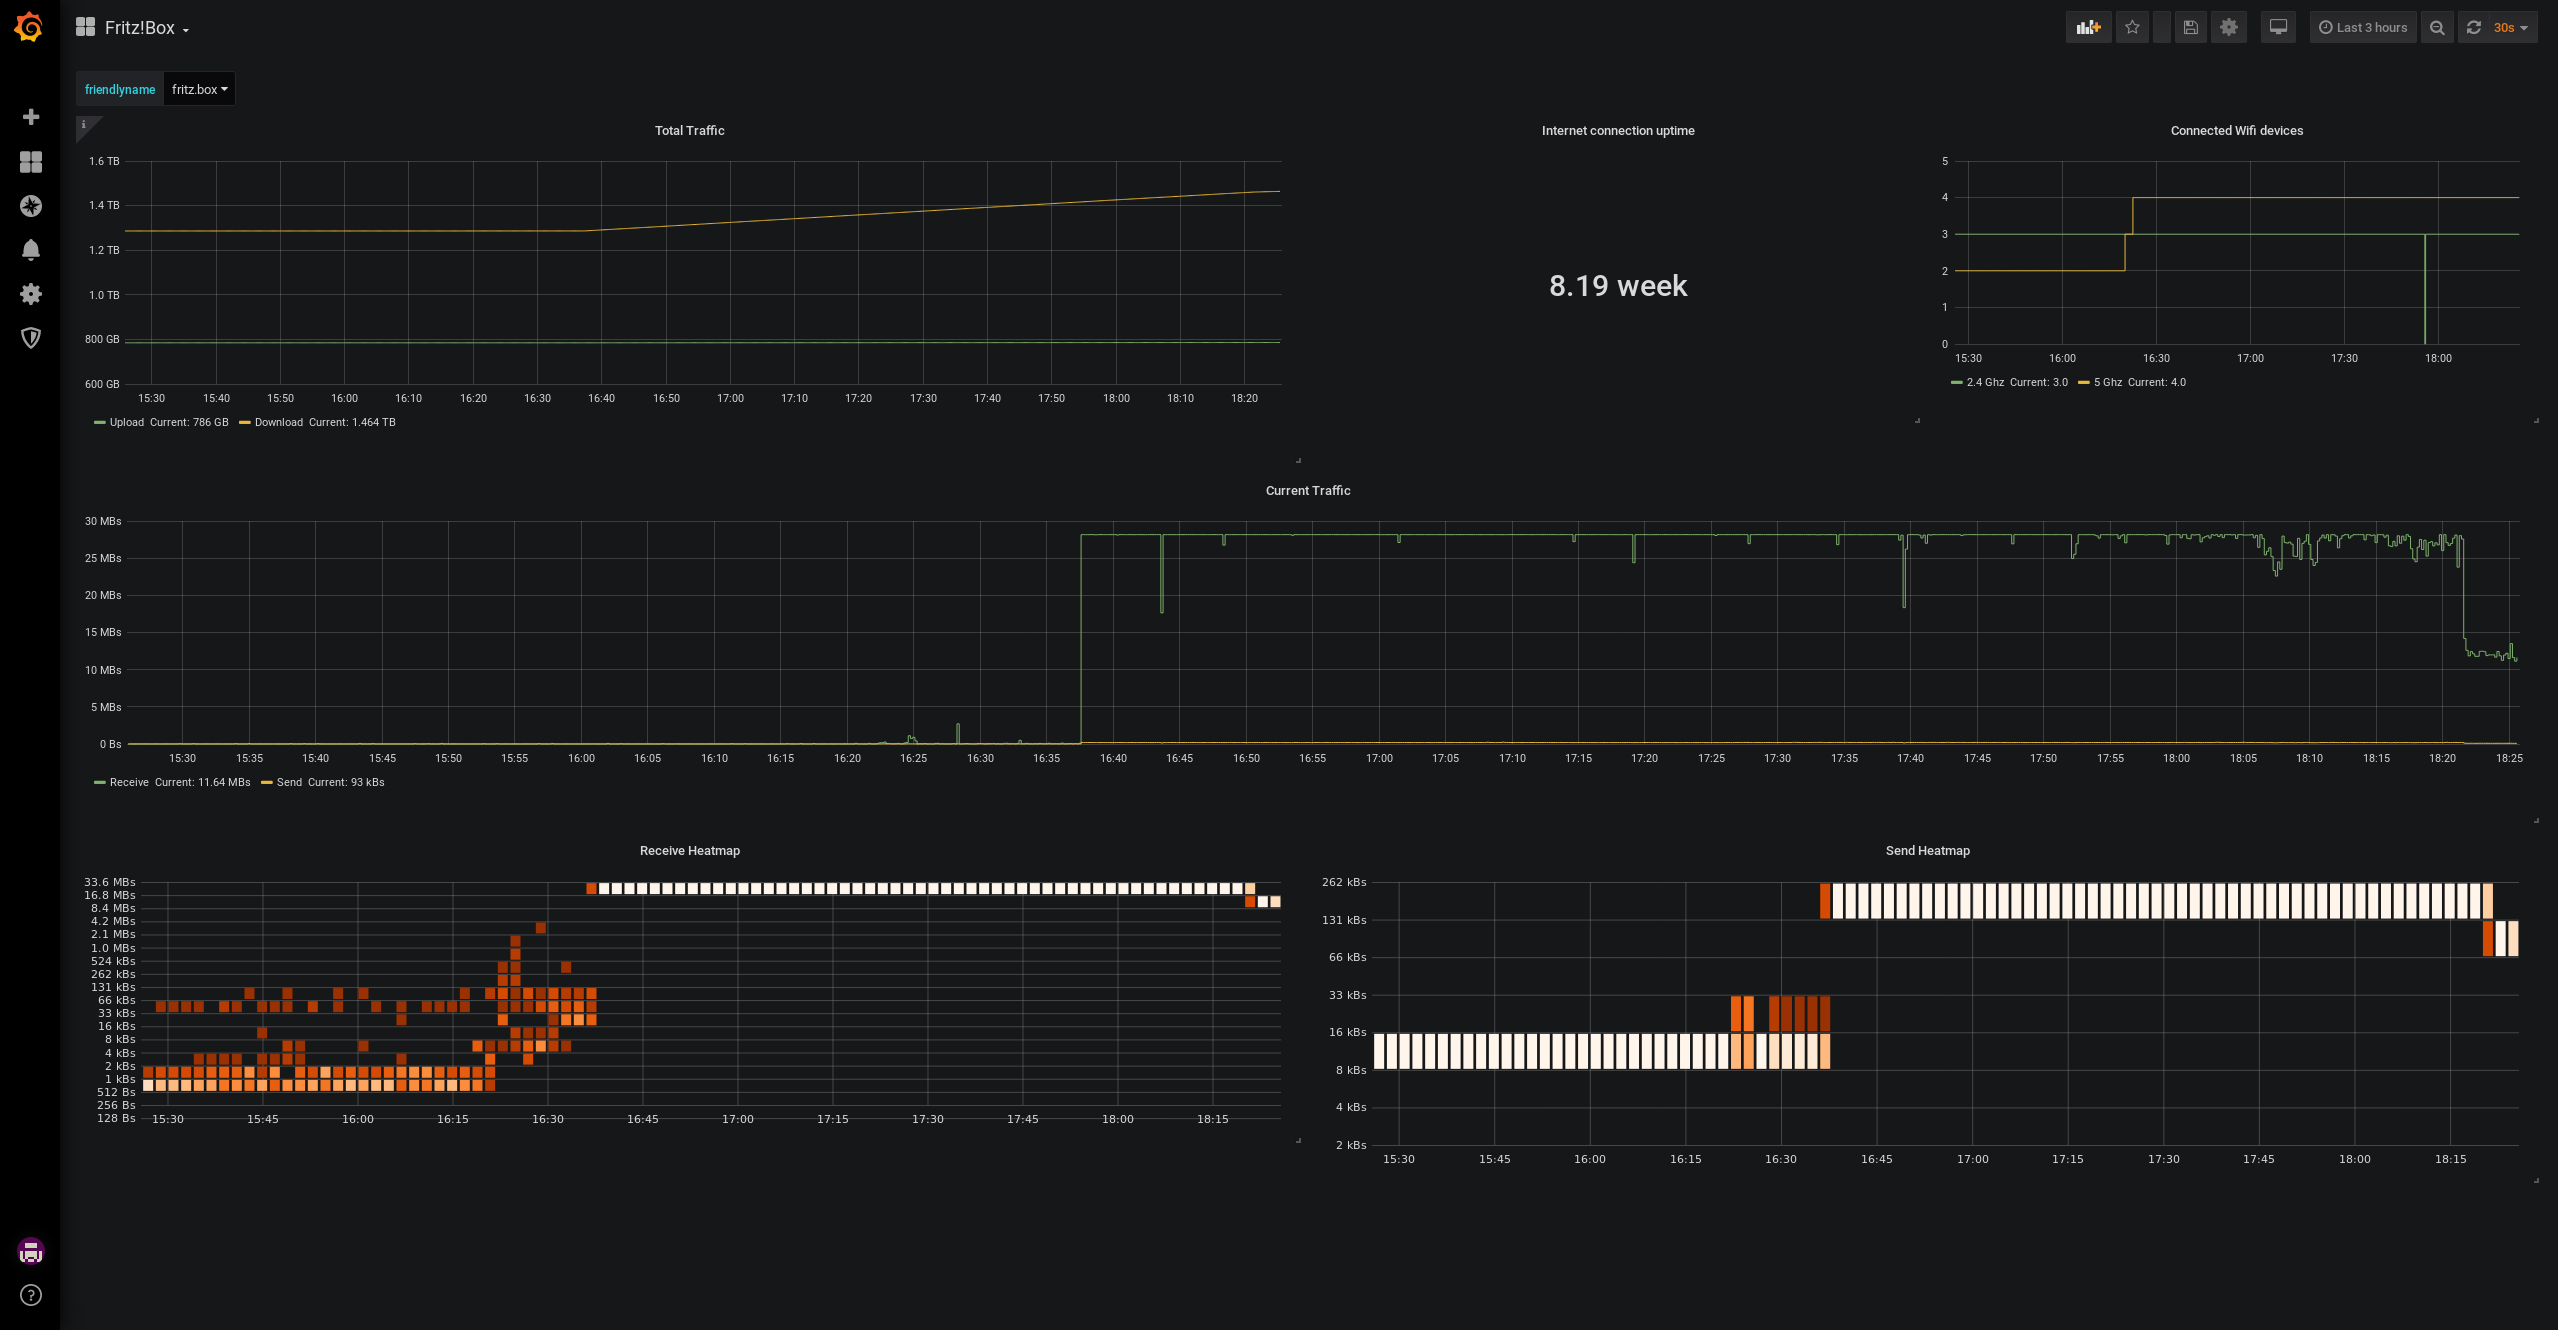
| grafana_fritzbox_dashboard_preview.png | ||
| telegraf_fritzbox | ||
README.md
telegraf-fritzbox - Simple Fritz!Box statistics for your Grafana
Requirements
- FritzBoxShell
- telegraf on a system which is in the same network as your Fritz!Box
- InfluxDB reachable by telegraf
- Grafana connected to InfluxDB
- fish shell
Setup
- Download
telegraf_fritzbox, put it somewhere on your system, change the variablefbshelland test if the script works by executing it - Verify that you've set proper permissions and user (e.g.
-rwx------ 1 telegraf root 2125 Jun 3 22:59 /usr/local/bin/telegraf_fritzbox*) - Place
fritzbox.confinto your telegraf config dir, e.g./etc/telegraf/telegraf.d/fritzbox.confand adjust the path totelegraf_fritzbox - Test the configuration by executing something like
telegraf -test --config /etc/telegraf/telegraf.d/fritzbox.conf - Restart telegraf
- Import
grafana_dashboard.jsoninto your Grafana instance - Enjoy!
Example Screenshot